Having data is no longer a competitive advantage. What’s important is how, when, and why you apply that data. How you turn data into actionable insights is what separates winning and failing project teams.
A survey revealed that 55% of organizations state at least half of their data is untapped or unknown. This gap is often due to data locked in silos, spread out across tools, or delivered in isolation. In short, access doesn’t translate to insight.
And that’s the challenge Kytes aimed to meet.
Kytes is changing the way professional services teams connect with their data in intuitive, AI-driven dashboards—to not only make project analytics accessible but intelligent. Whether you’re driving a portfolio of IT projects, overseeing R&D timelines within pharma, or operating multi-site engineering teams, these dashboards combine context, clarity, and control in one.
Why Traditional Dashboards Don’t Cut It Anymore
Dashboards have been around for decades. But in most organisations, they’re either too basic (bar charts and pie charts that say little), or too complex (built by BI teams for analysts, not decision-makers).
The result? Leadership flies blind, project managers scramble for updates, and teams continue to work reactively
What most traditional dashboards fail to offer:
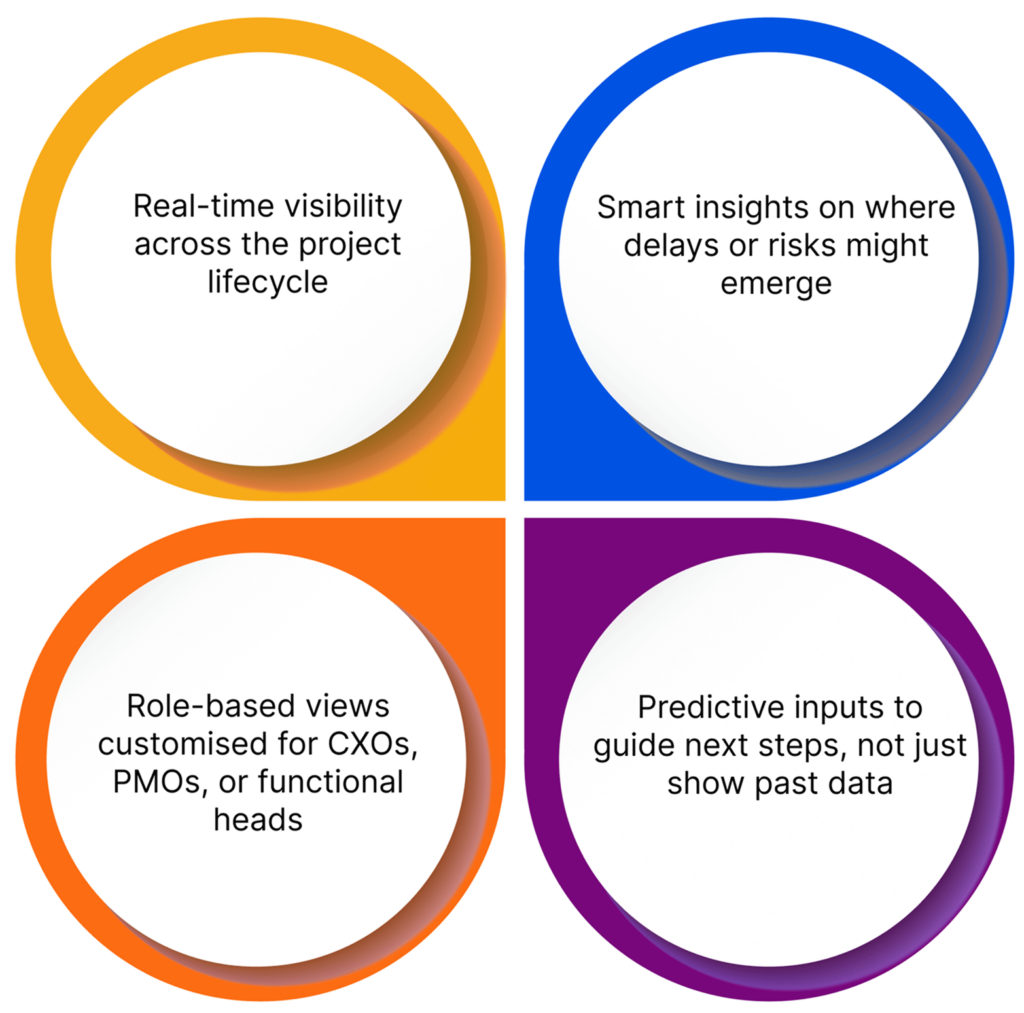
This is where Kytes’ AI-powered dashboards change the game.
From Data to Direction: The Kytes Difference
Kytes isn’t just adding another reporting layer. Its dashboards are natively integrated with its PSA + PPM platform—meaning they’re connected to real project workflows, timesheets, contracts, and risks.
The AI layer does the heavy lifting:
It pulls, prioritises, and presents what matters most—based on context, persona, and project status.
Whether you’re managing resource bottlenecks, financial leakage, or project delays, Kytes dashboards act as your command centre.
Let’s take a closer look at what sets them apart.
What Sets Kytes AI-Powered Dashboards Apart
1. AI That Thinks Beyond Visuals
Typical dashboards tell you what happened. Kytes dashboards, powered by Agentic AI, help you figure out why it happened and what to do next.
- Issue clustering: Related risks and issues are auto-grouped for quicker resolution
- Effort prediction: AI flags project phases where time/cost overruns are likely
- Meeting-to-MoM conversion: Action points from meetings are summarised and visualised instantly
- Live skills mapping: AI updates resource profiles in the background for smarter staffing insights
In short, you don’t just see metrics. You see movement—and how to act on it.
2. Power BI
Already using Power BI or planning to integrate it? Kytes plays well with it. While Kytes’ built-in dashboards cover real-time project ops, Power BI can be plugged in seamlessly to create even more advanced views for financial controllers or CIOs.
But for most teams, Kytes’ own dashboards eliminate the need for external BI setup, because:
- It’s real-time by design
- Role-based access comes out of the box
- No IT dependency or coding required
So, while your data teams can still deep-dive in Power BI, your project heads and delivery teams can stay self-sufficient and informed—instantly.
3. Real-Time, Multi-Dimensional Views
Kytes dashboards aren’t static reports. They’re live, interactive, and updated as your team works.
Every data point—whether it’s a risk update, a resource change, or a billing event—feeds directly into the dashboard, keeping everyone aligned.
Some of the key views include:
- Planned vs. Actual timelines and efforts
- Complexity vs. Opportunity maps across projects
- Risk-response heatmaps showing unresolved vs mitigated threats
- Revenue health and billability across customers and geographies
All this data is not just shown—it’s framed in context. You’ll know not just what’s red, but why it’s red, and what’s needed to fix it.
4. Role-Tailored Dashboards for Every Level
Not everyone needs the same level of detail. That’s why Kytes delivers custom dashboards for different stakeholders:
- CXOs: See financials, delivery trends, and portfolio health in board-ready views
- PMOs: Monitor project stage gates, delays, and compliance metrics
- Resource Managers: View availability, utilisation, and skill gaps live
- Delivery Leads: Drill into specific project timelines, risk flags, and open items
This modularity makes Kytes dashboards ideal for enterprise-scale deployments—where visibility needs to scale without overwhelming every user.
5. Designed for the Way You Work
Kytes dashboards are built to reflect how teams actually operate, not how BI analysts think they should. With deep integration across Kytes modules—like WBS generation, timesheets, staffing, and billing—your data flows without friction.
Here’s how Kytes dashboards improve everyday execution:
- During planning: Visualise WBS and Gantt from AI-generated project plans
- During delivery: Spot blockers and escalations in real-time
- During reporting: Export CXO dashboards instantly for leadership reviews
- During resourcing: Track compliance, availability, and skill coverage across regions
This isn’t just convenient—it’s transformative. Because when dashboards speak your language, action follows naturally.
6. No More Hunting for Insights
With Kytes’ built-in dashboard capabilities, you don’t need to dig through five tabs to answer one question. The system surfaces what’s important, based on your project context, role, and urgency.
For example:
- Want to know resource availability for Project X? It’s a click away.
- Curious about open issues flagged last week? Already summarised.
- Need a board-ready slide on revenue leakage this quarter? Generated in seconds.
And if you work inside Microsoft Teams? You’ll love this—Kytes dashboards are accessible inside Teams too. You can check project health, view MoMs, and access attendance—all without switching tabs.
7. Future-Proof with Agentic AI
Unlike traditional dashboards that rely on past data, Kytes’ Agentic AI makes dashboards forward-looking.
What does that mean?
- It recommends staffing adjustments before conflicts arise
- Flags missed billing opportunities before they’re lost
- Identifies project patterns that typically lead to delays or scope creep
- Learns from your delivery cycles to improve how data is framed for you
In other words, it’s not just AI that reports—it’s AI that advises.
Final Thoughts
Let Your Dashboards Think With You and Work For You
It’s time dashboards did more than just look good.
With Kytes AI-powered dashboards, you’re not just tracking delivery—you’re improving it. These dashboards take your data from passive to proactive, turning metrics into motion, and visibility into velocity. They’re built for enterprise teams, designed for real users, and driven by AI that understands your world—from project charters to timesheets, staffing to strategy.
What does that mean for you? Fewer surprises at month-end, smarter staffing that cuts bench costs, and projects that stay aligned from execution to invoicing. With Kytes, it’s not just about knowing what’s happening—it’s about shaping what happens next. Book a Demo to see Kytes PSA+PPM in action.