Blog Highlights
- Gantt chart software helps project teams visualize timelines, manage task dependencies, track milestones, and identify potential scheduling delays.
- Traditional spreadsheets and task boards often fail to reveal resource conflicts, overlapping schedules, and the downstream impact of project delays.
- Modern Gantt chart software offers automated rescheduling, critical path tracking, multi-project visibility, and integration with resource and financial management.
- AI-enabled Gantt chart software improves project planning through predictive schedule risk alerts, intelligent resource allocation, and automated work breakdown structures.
- Kytes integrates Gantt chart scheduling with resource management, project financials, and portfolio visibility, helping businesses improve delivery efficiency and control project costs.
In the last year, an EPC project manager in Mumbai made the switch to a widespread task board. Daily stand-ups became quick. Cards zipped across the board and people felt good. Until the steel delivery was three weeks late and no one knew because there was no visualization of the delivery date in the task board – the task board didn’t show the procurement of the steel was delayed by 3 weeks, which delayed the foundation pour by 18 days, which delayed electrical rough-in into the monsoon season, which tacked 2 more months to the design-build completion date.
This is what task boards cannot solve. They show you status, but not time. That’s the purpose of Gantt chart software – to visualise time – to lay all of your tasks onto a timeline, link them together with dependencies and visualise exactly what moves when one thing is late.
Gantt software industry was worth US$500m in 2025 and US$1.2bn in 2033 (10.5 per cent CAGR). No I’m not sentimental – this is a good thing as it means there is a tool for businesses handling multistage, multiservice projects that answers the question that no task board can: ‘If this slips, what else breaks?’
What Is a Gantt Chart Tool and Why Does It Still Matter?
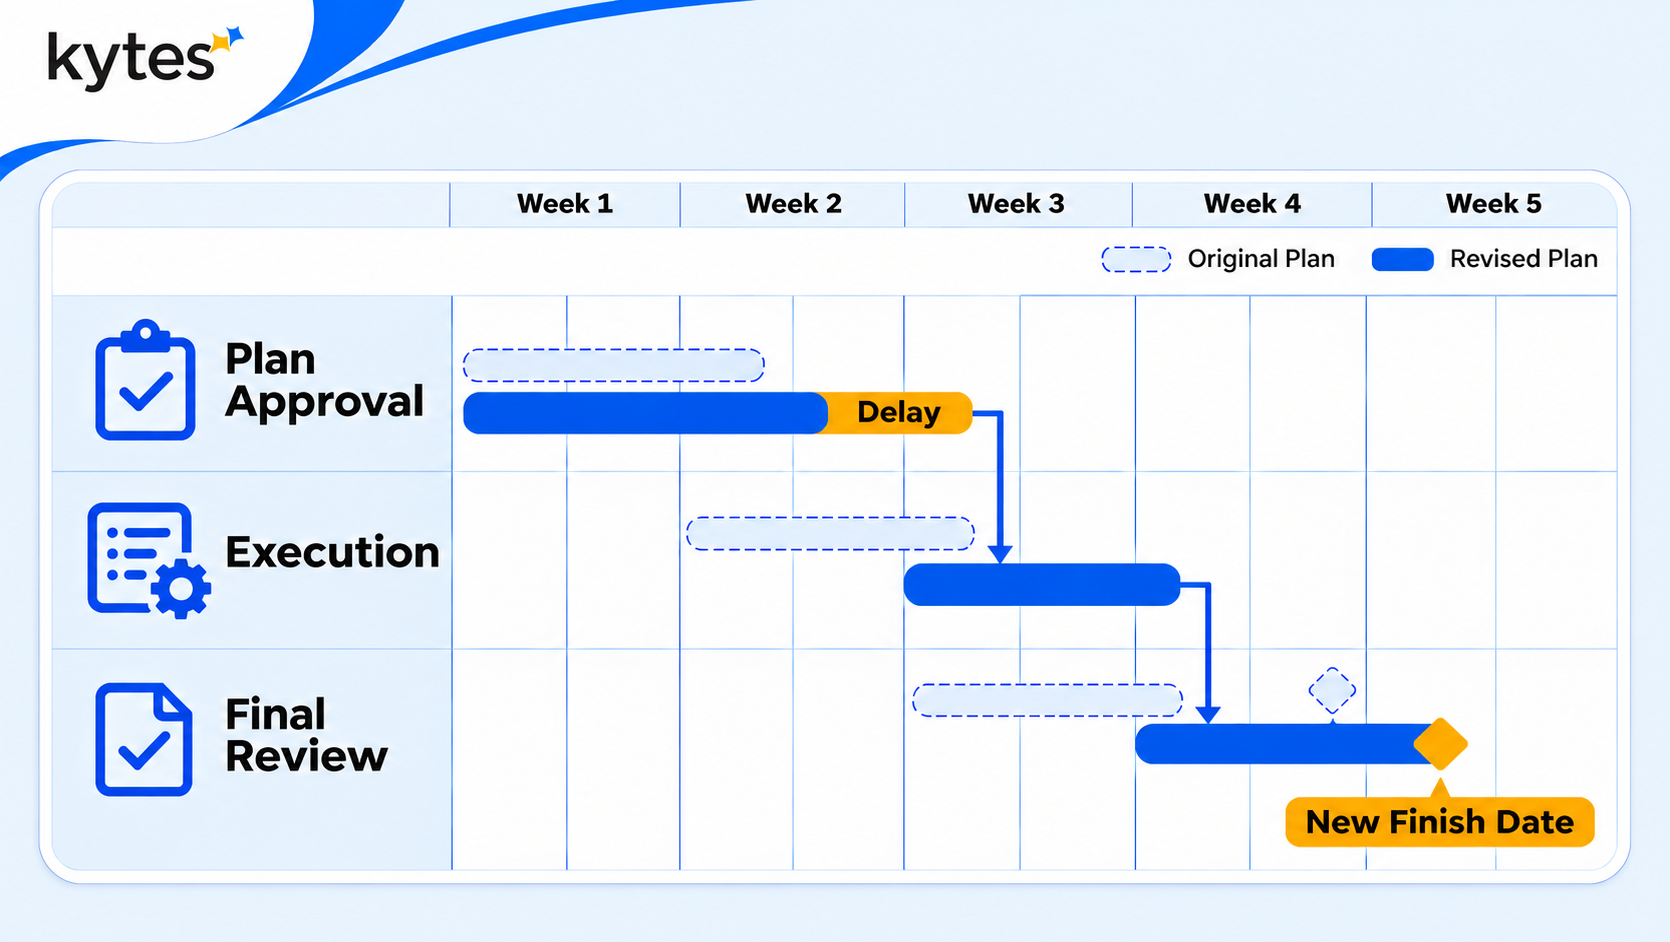
A Gantt chart tool is a project scheduling software that charts tasks, milestones and dependencies on a horizontal timeline. Each bar corresponds to a task, and the length of the bar reflects the duration; lines between bars indicate dependencies – one bar will shift to follow the movement of the previous bar.
The format is over 100 years old. Its staying power is because complexity of projects has surpassed what any other can. According to a survey by Wellingtone 2020, only 29 percent of companies complete projects on time; in PMI 2020 survey, 11.4 percent of project resources are wasted due to poor project management practices. These metrics have not improved; if anything, remote teams, multi-location execution, and shorter schedules have made scheduling worse.
Kanbans, sprint backlogs, and to-do lists are all addressing a part of the problem. The definitely aren’t providing a timeline with a chain of dependencies. That’s the what Gantt tools deliver – and why they are still the norm for scheduling in engineering, pharma, services, and EPC.
What Breaks When You Schedule Without a Gantt View?
Three things fail. Each one costs money, time, or client trust.
Dependencies go invisible-On the task board, each card lives in a column – backlog, in progress, done. There’s no link. When a senior engineer completes a design review, it doesn’t turn on the build column for the next team in line on a task board. On a Gantt, that hand-off is a line drawn between two tasks. When it’s late, the build start date moves on the screen. The PM sees the update the same day, not Monday.
Resource conflicts hide-Scheduling software that isn’t visual won’t present you two projects requiring the same person in the same week. The PM feels they’re “assigning” tasks; the engineer is cognizant of two deadlines. However, no one can see this collision until one project fails and kills the other. Gantt charts make this collision clear & visual – multiple bars on the same row, same week, same person.
Milestone drift compounds silently-A task that falls behind schedule by three days is less of a concern. However, four tasks that fall behind schedule by three days in a row, and they are consecutive, will now make your project late by 12 days. A Gantt view makes this too much information available in real time. A task list does not provide any visibility about such issues. Only 25 percent of projects surveyed by KPMG in 2020 were delivered successfully. Poor schedule visibility is partly to blame for that.
How Have Gantt Tools Evolved Beyond Static Timelines?
The Gantt chart of 2026 is not the Gantt chart of 2010. Three shifts have changed what the tool can do.
Real-time updates replace manual re-planning-Instant updates avoid re-planning by hand. Previous project management programs: The PM would have to re-create the plan if changes occurred. New project scheduling applications: When a predecessor shifts, downstream activities automatically reschedule. The PM analyzes the change, rather than remedying the plan.
AI adds prediction-The top systems ingest historical project schedules to identify risks before they happen. If another project experience three weeks of delay at that step in the process last year, the system notifies the PM. A PwC Future of Work survey of project managers uncovered on average,8.2 hours of weekly work time was saved by PMs using AI by eliminating time-consuming scheduling and assignment activities.
Resource and financial data connect to the timeline-Resource and cost data links to the schedule. A Gantt bar that represents task duration is helpful. A Gantt bar that can also identify who is assigned, at what cost rate, and what is the impact of the schedule change on margin is awesome. This is the transition from scheduling to project planning software where time, people and money are on the same view.
What Should You Look for in a Gantt Scheduling Tool?
Not every Gantt tool fits every team. Here is what separates a useful platform from a basic chart drawer.

For decision makers in India and the US running complex delivery across time zones, three of these matter most: auto-reschedule (because manual re-planning at scale is impossible), multi-project view (because resource conflicts live between projects, not within them), and financial overlay (because a schedule that ignores cost is a schedule that ignores reality).
When Should a Team Move Beyond Spreadsheet Gantt Charts?
“Many teams begin with Excel or Google Sheets Gantt Templates. That’s fine at a small scale. It breaks down when any of these apply:
You are managing more than 10 simultaneous projects. The spreadsheet cannot capture project interdependencies or resources conflicts. You need to do more manual updates, which grows faster than the number of projects.
More than one PM messed with the schedule. Spreadsheet version control is an etiquette fiction. The combined efforts of two PMs working on the same file produce merge conflicts no formula can resolve.
“Everyone wants to know what’s going on in the moment. If a client or your execs ask ‘where are we now?’ and you have to say ‘I’ll get back to you’ while you update the sheet, it’s the bottleneck.”
Cross-team or cross-vendor dependencies. You can’t auto-cascade a delay in a spreadsheet Gantt from one team’s task to another team’s milestone. That’s the gap where projects go late.
A project management industry survey had 24 percent of respondents claim repetitive data entry as their biggest time hog. And, in project scheduling, it’s updating a spreadsheet timeline each week that should update itself.
How Does AI Change What Gantt Software Can Do?
AI takes Gantt charts from a display tool to a decision tool. Three capabilities matter.
Schedule risk prediction-AI learns from previous projects – what’s likely to be late, what’s weak and what resource types are creating bottlenecks. It spots a risk before the PM ever does. The SPI Research 2026 benchmark revealed 79.5 percent billable utilization among high performing firms, compared with 69.9 percent across the rest. That margin frequently reflects more effective scheduling – getting the right people working on the right project at the right time.
Resource-aware scheduling-AI doesn’t just reveal who is assigned. It suggests who should be assigned based on skill fit, rate, availability, and project history. A PM tool that plans tasks without knowing resource load creates issues it cannot identify.
Auto-generated project plans-AI reads a scope doc or SOW and creates a WBS with task estimates, dependencies, and milestones. The PM looks at a working plan, not a blank screen, changing what the PM creates from a schedule to a plan that is analyzed and optimized.
How Does Kytes Handle Project Scheduling and Gantt Views?
Kytes is an AI-enabled PSA and PPM platform built for project-driven enterprises — IT and engineering services, pharma, EPC, and GCC firms. It does not force a choice between project management and financial management. Both live on the same data layer.
Kytes links schedules to utilization, cost rates, and project budgets. When you update a schedule, you aren’t simply shifting a bar on the Gantt. You are simultaneously revising the resource utilization forecast, margin view, and billing schedule. That is the power of an integrated project delivery platform.
Kytes AI creates project artifacts – charters, work breakdown structures and milestone plans – from scope documents. It predicts delays by current trends and issues risk notifications upfront. The delivery teams operate from a collaborative plan, and not a blank sheet.
How Does Kytes Handle Project Scheduling and Gantt Views?
Kytes is a project-based working AI-enabled PSA & PPM platform developed for project-driven organizations – IT & Engineering services, pharma, EPC, and GCC. The project management module delivers scheduling, you are doing this within the same platform that does resources, financials, and the entire opportunity-to-cash process.
Kytes links schedules to utilization, cost rates, and project budgets. When you update a schedule, you aren’t simply shifting a bar on the Gantt. You are simultaneously revising the resource utilization forecast, margin view, and billing schedule. That is the power of an integrated project delivery platform.
Kytes AI creates project artifacts – charters, work breakdown structures and milestone plans – from scope documents. It predicts delays by current trends and issues risk notifications upfront. The delivery teams operate from a collaborative plan, and not a blank sheet.
The platform compares the need for resources against the availability of those resources for all current and pipeline projects. When a schedule change creates a slack or strain on a resource, it is identified as a potential conflict before it actually becomes one. Engineering service customers experience 14 percent increased utilization and 21 percent faster delivery cycle time in the first quarter.
Delivery managers view schedules for the whole portfolio – not a project at a time. Dependencies between projects, competition between resources and sharp clusters of milestones are visible in a single view. For companies with more than 50 projects in India and the US, this is the difference between speculation and control.
Kytes syncs with SAP, Oracle, Net Suite, Tally, and Workday. No more exporting and importing financial data, resource records, and project plans.
Frequently Asked Questions